Delivery Dashboard
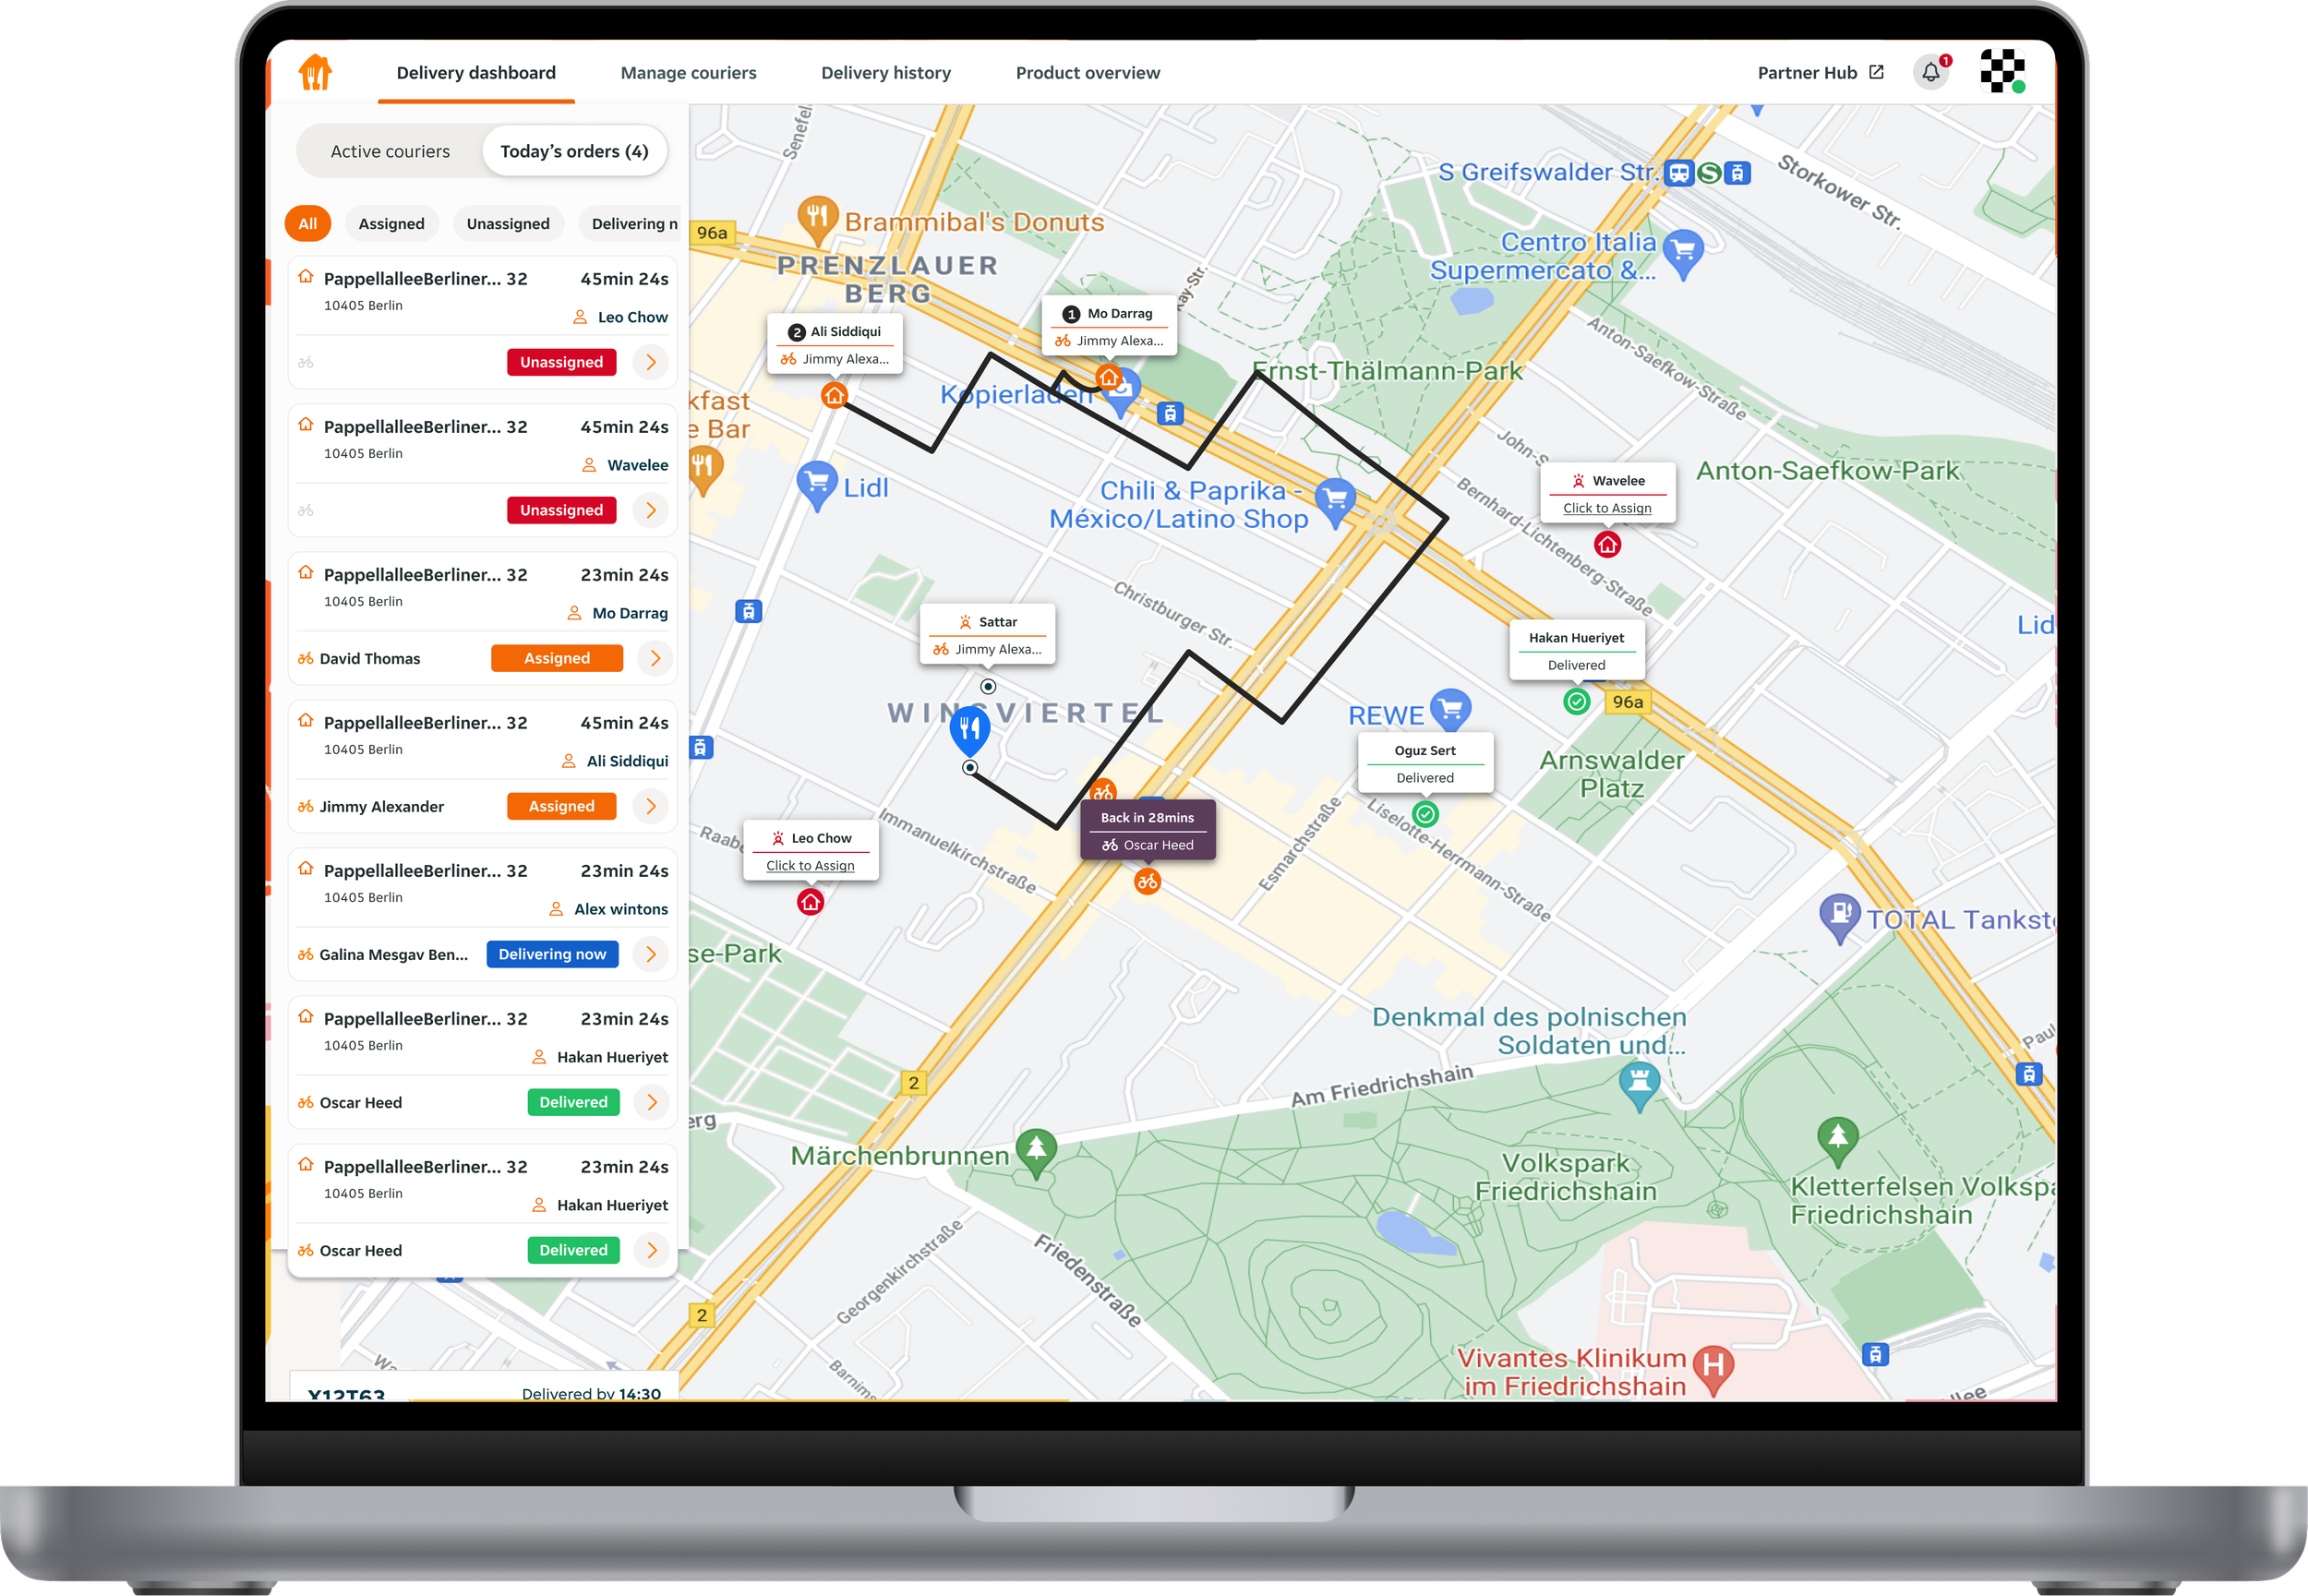
The Delivery Dashboard is a web tool that helps Just Eat partners monitor their courier fleet, increasing operational visibility, and improving the customer delivery experience through more consistently tracked orders.
This project involved a ground up redesign of the Delivery Dashboard along with the introduction of a new performance insights feature.
Team
Senior designer (me), Senior PM, compact product team
Impact
21% increase in regular users of Delivery Dashboard
5% increase in total tracked orders
The challenge
Just before I joined the team, a large evaluative research study on the existing tool surfaced several critical issues that limited adoption, trust, and long-term value.
At a high level, the tool was failing both operationally and strategically.
Key problems identified
Poor mobile experience
Around 40% of users accessed the tool on mobile, yet the experience was slow, frustrating, and not optimised for mobile.Mismatch with real delivery behaviour
Most orders are delivered as part of a pooled route, but the UI was designed around individual orders. This made it hard for partners to understand, plan, and manage deliveries efficiently.Overloaded and inconsistent map UI
The map had evolved organically over time, with no predefined colour system or clear visual hierarchy. As new features were added, the interface became increasingly difficult to scan and cognitively heavy.Reliability issues
Bugs and inconsistencies reduced trust in the tool.Unclear value proposition for partners
The tool was not considered essential by many partners. It had originally been introduced to encourage courier tracking, improving customer experience and business outcomes. However, partners often did not understand why they were being asked to use it, or how it benefited them directly. This meant rethinking not just how the tool worked, but how its value was communicated through the experience itself.
Defining the opportunity
While the Product Manager, Group Product Manager, and I were aligned on pursuing an ambitious redesign, I recognised a clear risk. This was a fast-moving team working with users who were difficult to research, which made it easy to default to assumptions and solution-led thinking. I pushed for a more grounded approach, anchored in user needs and existing insights, to ensure we were solving the right problems before committing to design and build.
We made a plan to:
Reassess the product’s value proposition
Define a new north star
Divide the build into manageable iterations
The value proposition
I designed and facilitated a workshop that brought together multidisciplinary stakeholders to create shared alignment on the product’s purpose and priorities.
As a group we:
Revisited the current-state user journey and key product touchpoints.
Aligned on the latest research insights and most significant partner pain points.
Used a Value Proposition Canvas to explicitly connect the product to partner needs.
This process helped us define a clear value proposition we wanted to communicate more explicitly through the product experience.
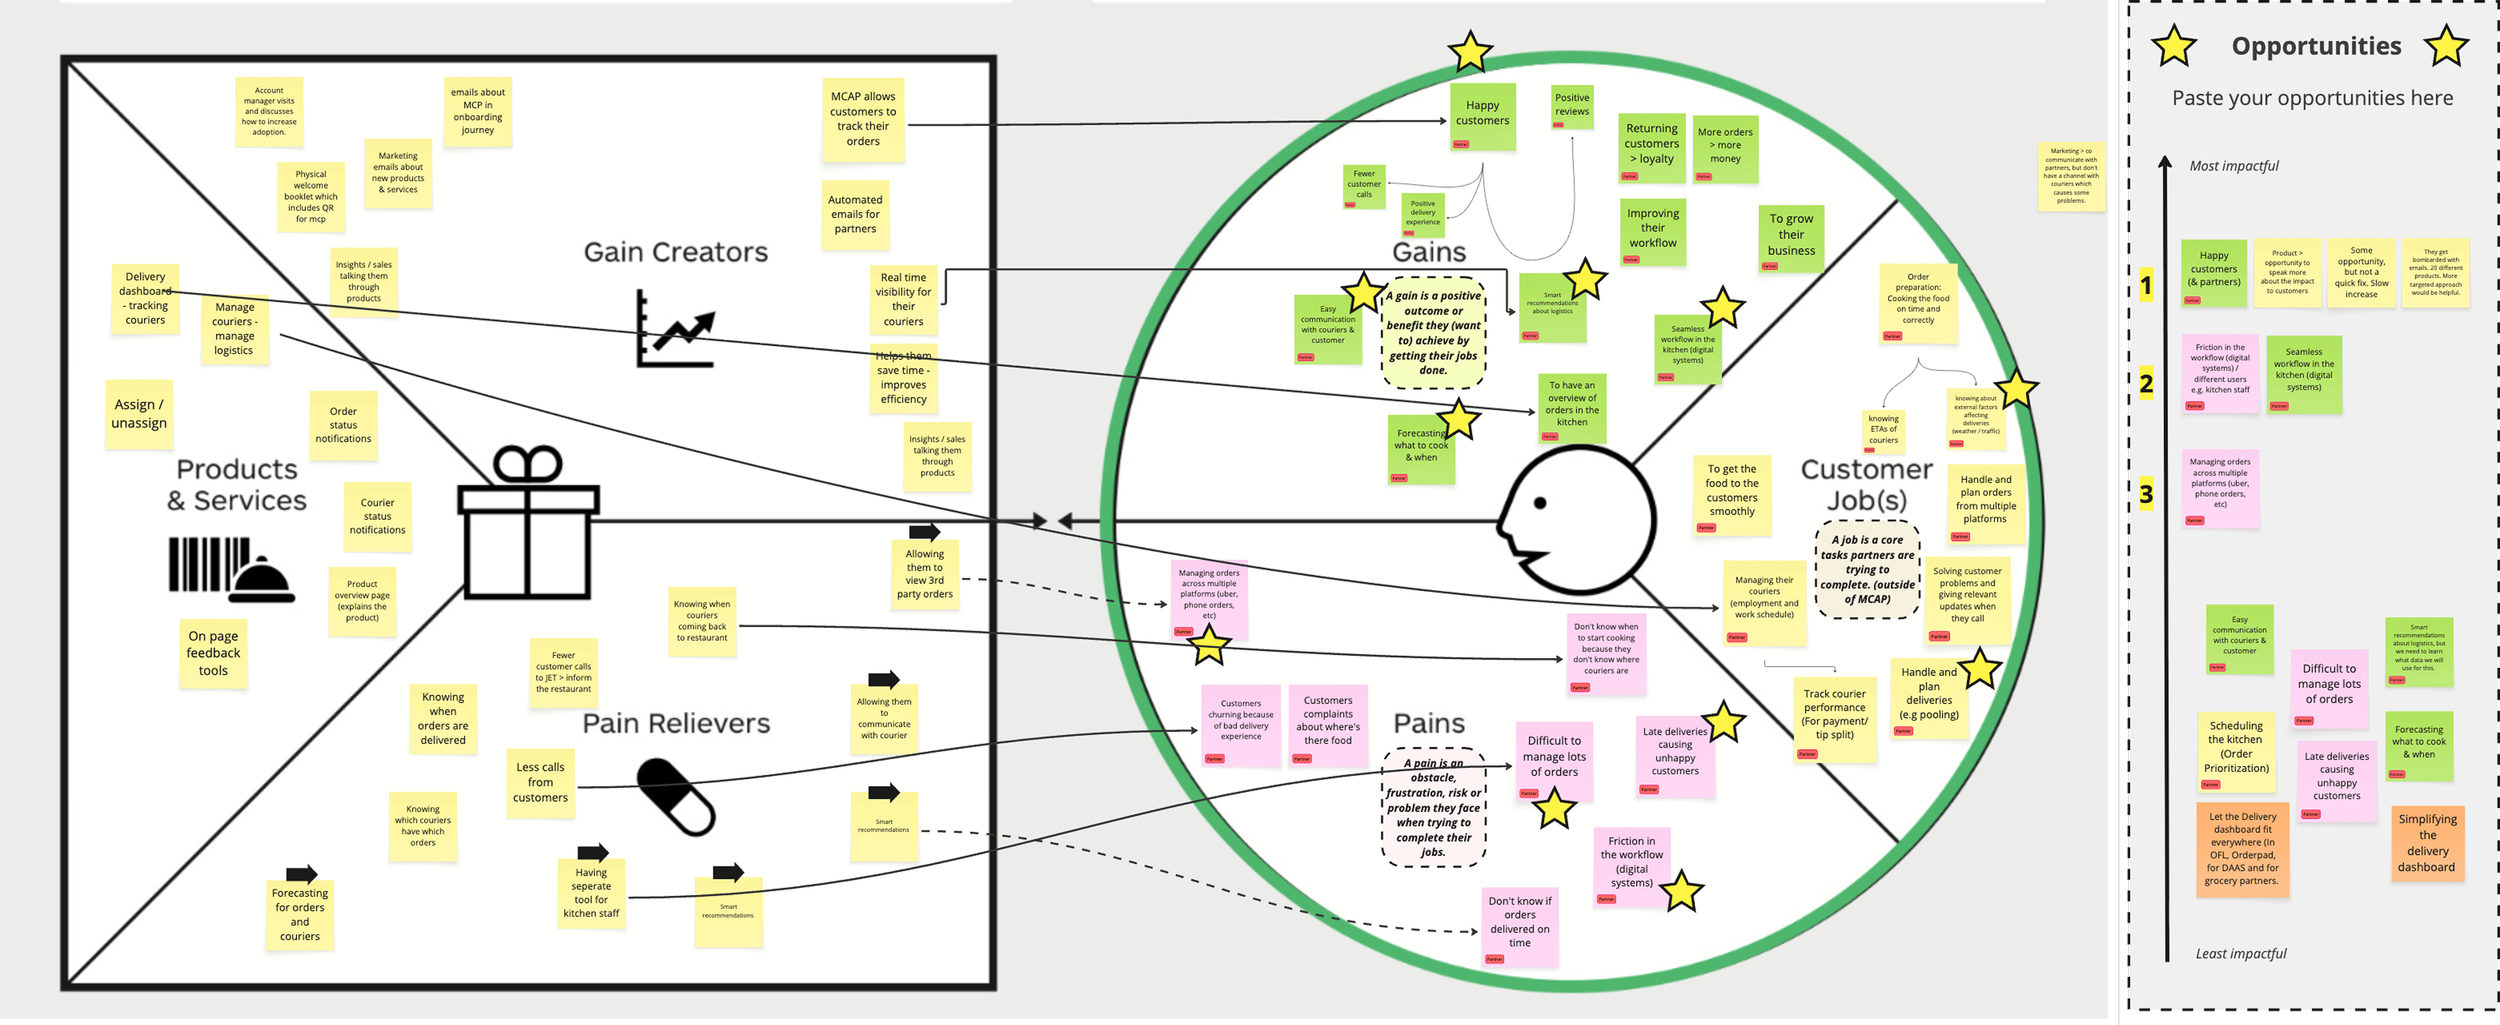
“Delivery Dashboard helps you create happier customers by encouraging higher-quality deliveries and a higher percentage of tracked orders.”
North Star
With a clear understanding of user problems and a defined opportunity to strengthen the product’s value proposition, the next step was to align on a shared future direction.
I designed and facilitated an ideation workshop with stakeholders from Product, Engineering, Operations, and Data. Ahead of the session, I translated our UX research into a focused set of How Might We questions to ensure discussions stayed anchored in real user needs.
Together, we:
Revisited key UX research insights.
Reviewed user behaviour data from Analytics.
Ideated in small groups, generating concepts in response to the How Might We prompts.
The outcome was collective input into a North Star that aligned teams around a common vision and provided a practical reference point for prioritisation and design decisions throughout the redesign.
Design exploration
With a strong understanding of the UX research, a clear value proposition, and alignment on a North Star, we were ready to begin the design phase. The work up to this point resulted in a clear set of requirements that guided design exploration:
Prioritise clarity on mobile, where a significant proportion of partners used the tool.
Reduce cognitive load through simpler colour usage, clearer hierarchy, and more predictable interactions.
Make pooled orders easier to understand and manage.
Surface the value of using the tool more explicitly, using the newly defined value proposition.
With these requirements in place, we explored multiple concepts through iterative design and testing. Below are two examples that show how the design evolved in response to user feedback and technical constraints.
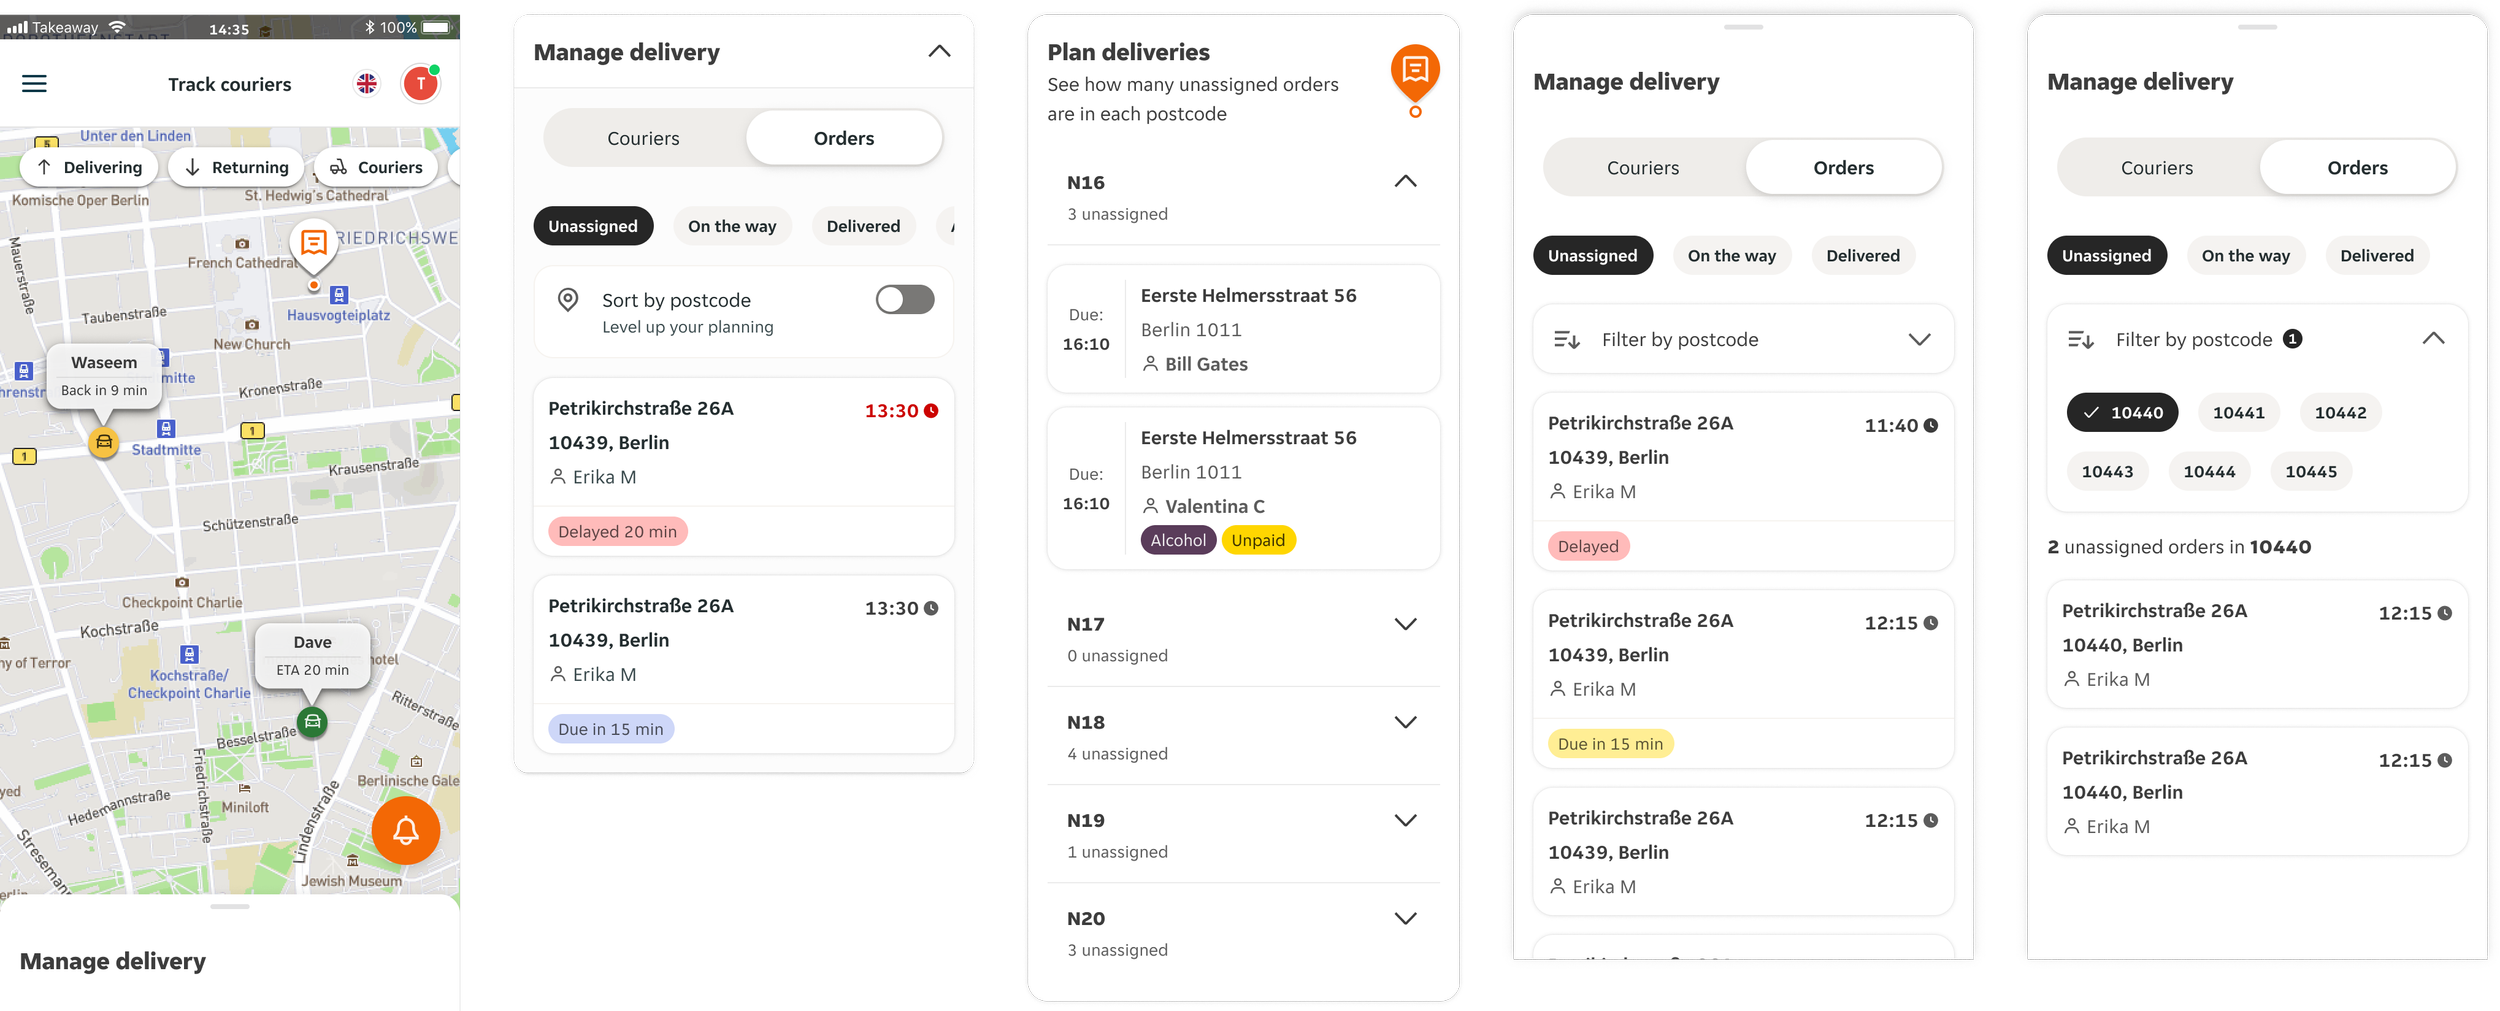
Filtering the map was one of the key UX challenges. On small screens, the interface can quickly become overwhelmed with couriers and orders. Partners needed a simple way to filter what they were seeing - for example, only returning couriers, only unassigned orders, or orders in a specific postcode.
We explored multiple approaches. Placing filters directly on the map felt too fiddly on mobile and disconnected from the main workflow. We also tested moving order filters into a dedicated “Plan Deliveries” section, which performed better but created confusion, as partners expected all filtering controls to live in one place.
We ultimately converged on the final approach shown in the last two screens: layered filtering within the control panel. Partners can switch between Couriers and Orders, filter by order status, and then filter further by postcode. This version tested strongly in usability sessions and became the basis for our final solution.
Example 1: Filtering
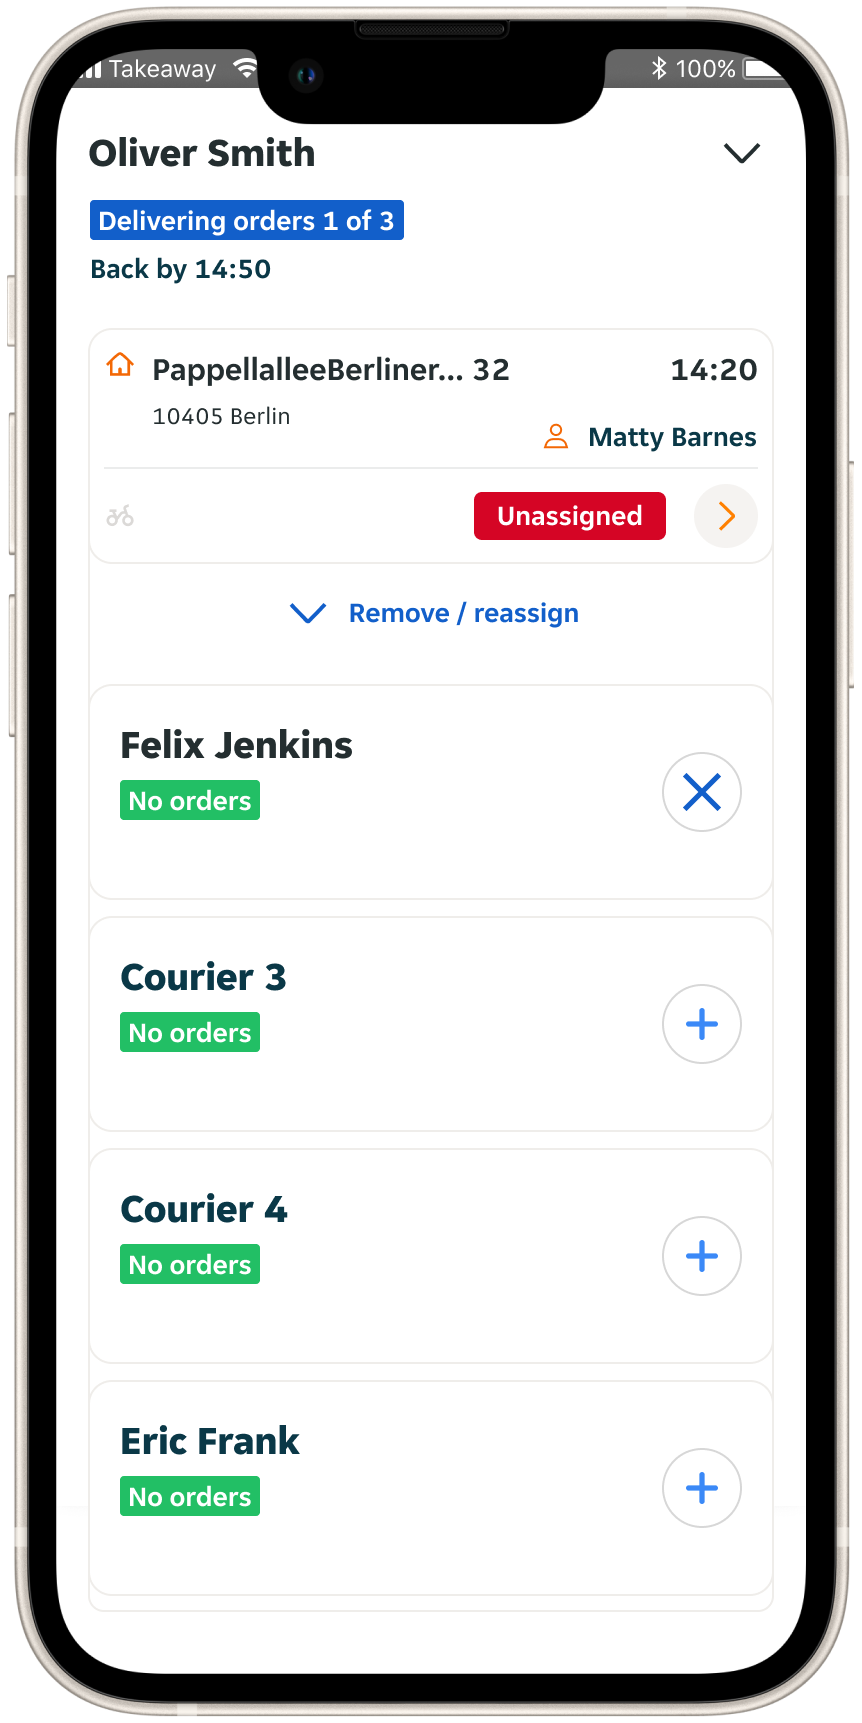
Example 2: Order cards and pooled orders
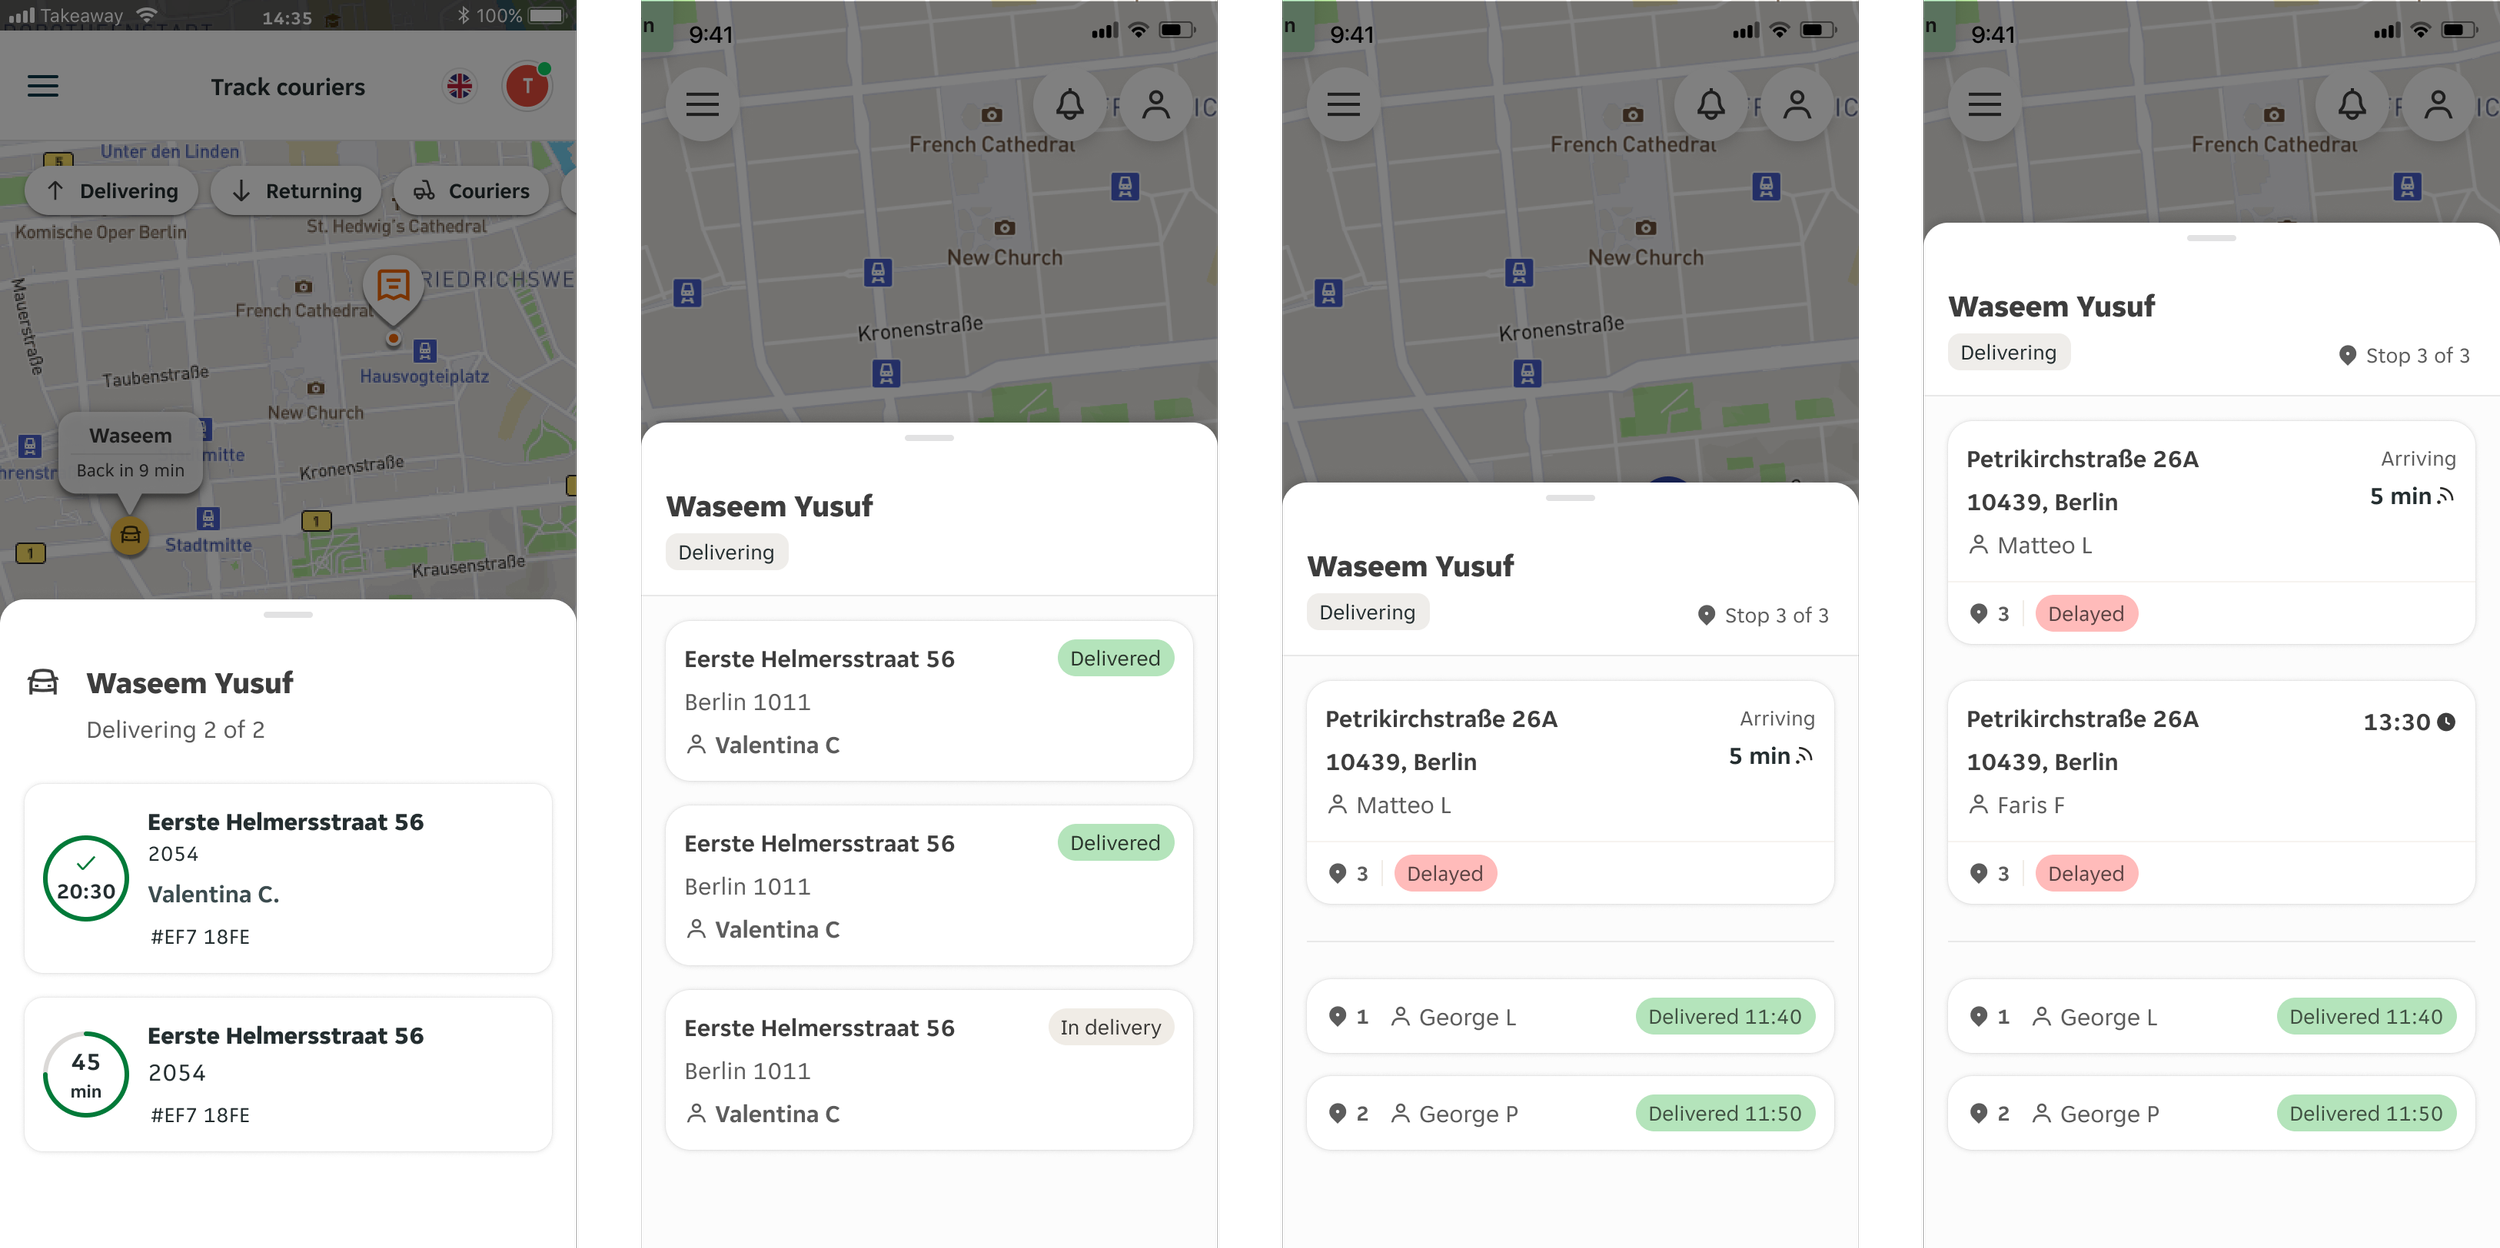
Order cards and pooled order visibility were other features requiring careful iteration. Each card needed to communicate a large amount of information at a glance - the courier, customer, address, order ID, original estimated due time, the GPS-driven arrival time, and, in pooled orders, both delivery status and the stop sequence.
Early iterations used a circular countdown timer to show the original estimated due time, but usability testing revealed a recurring issue: users consistently mistook this for the courier’s GPS-driven arrival time. This created confusion at critical moments, especially when an order appeared "late" due to incorrect interpretation.
We explored several ways to differentiate the two time concepts, but the solutions either added cognitive load or weren’t noticed. The final approach shown on the right - using clear iconography and distinct labels for each type of time - resolved the confusion. This tested well, improved scannability, and made it easier for partners to understand exactly what was happening.
Design solution
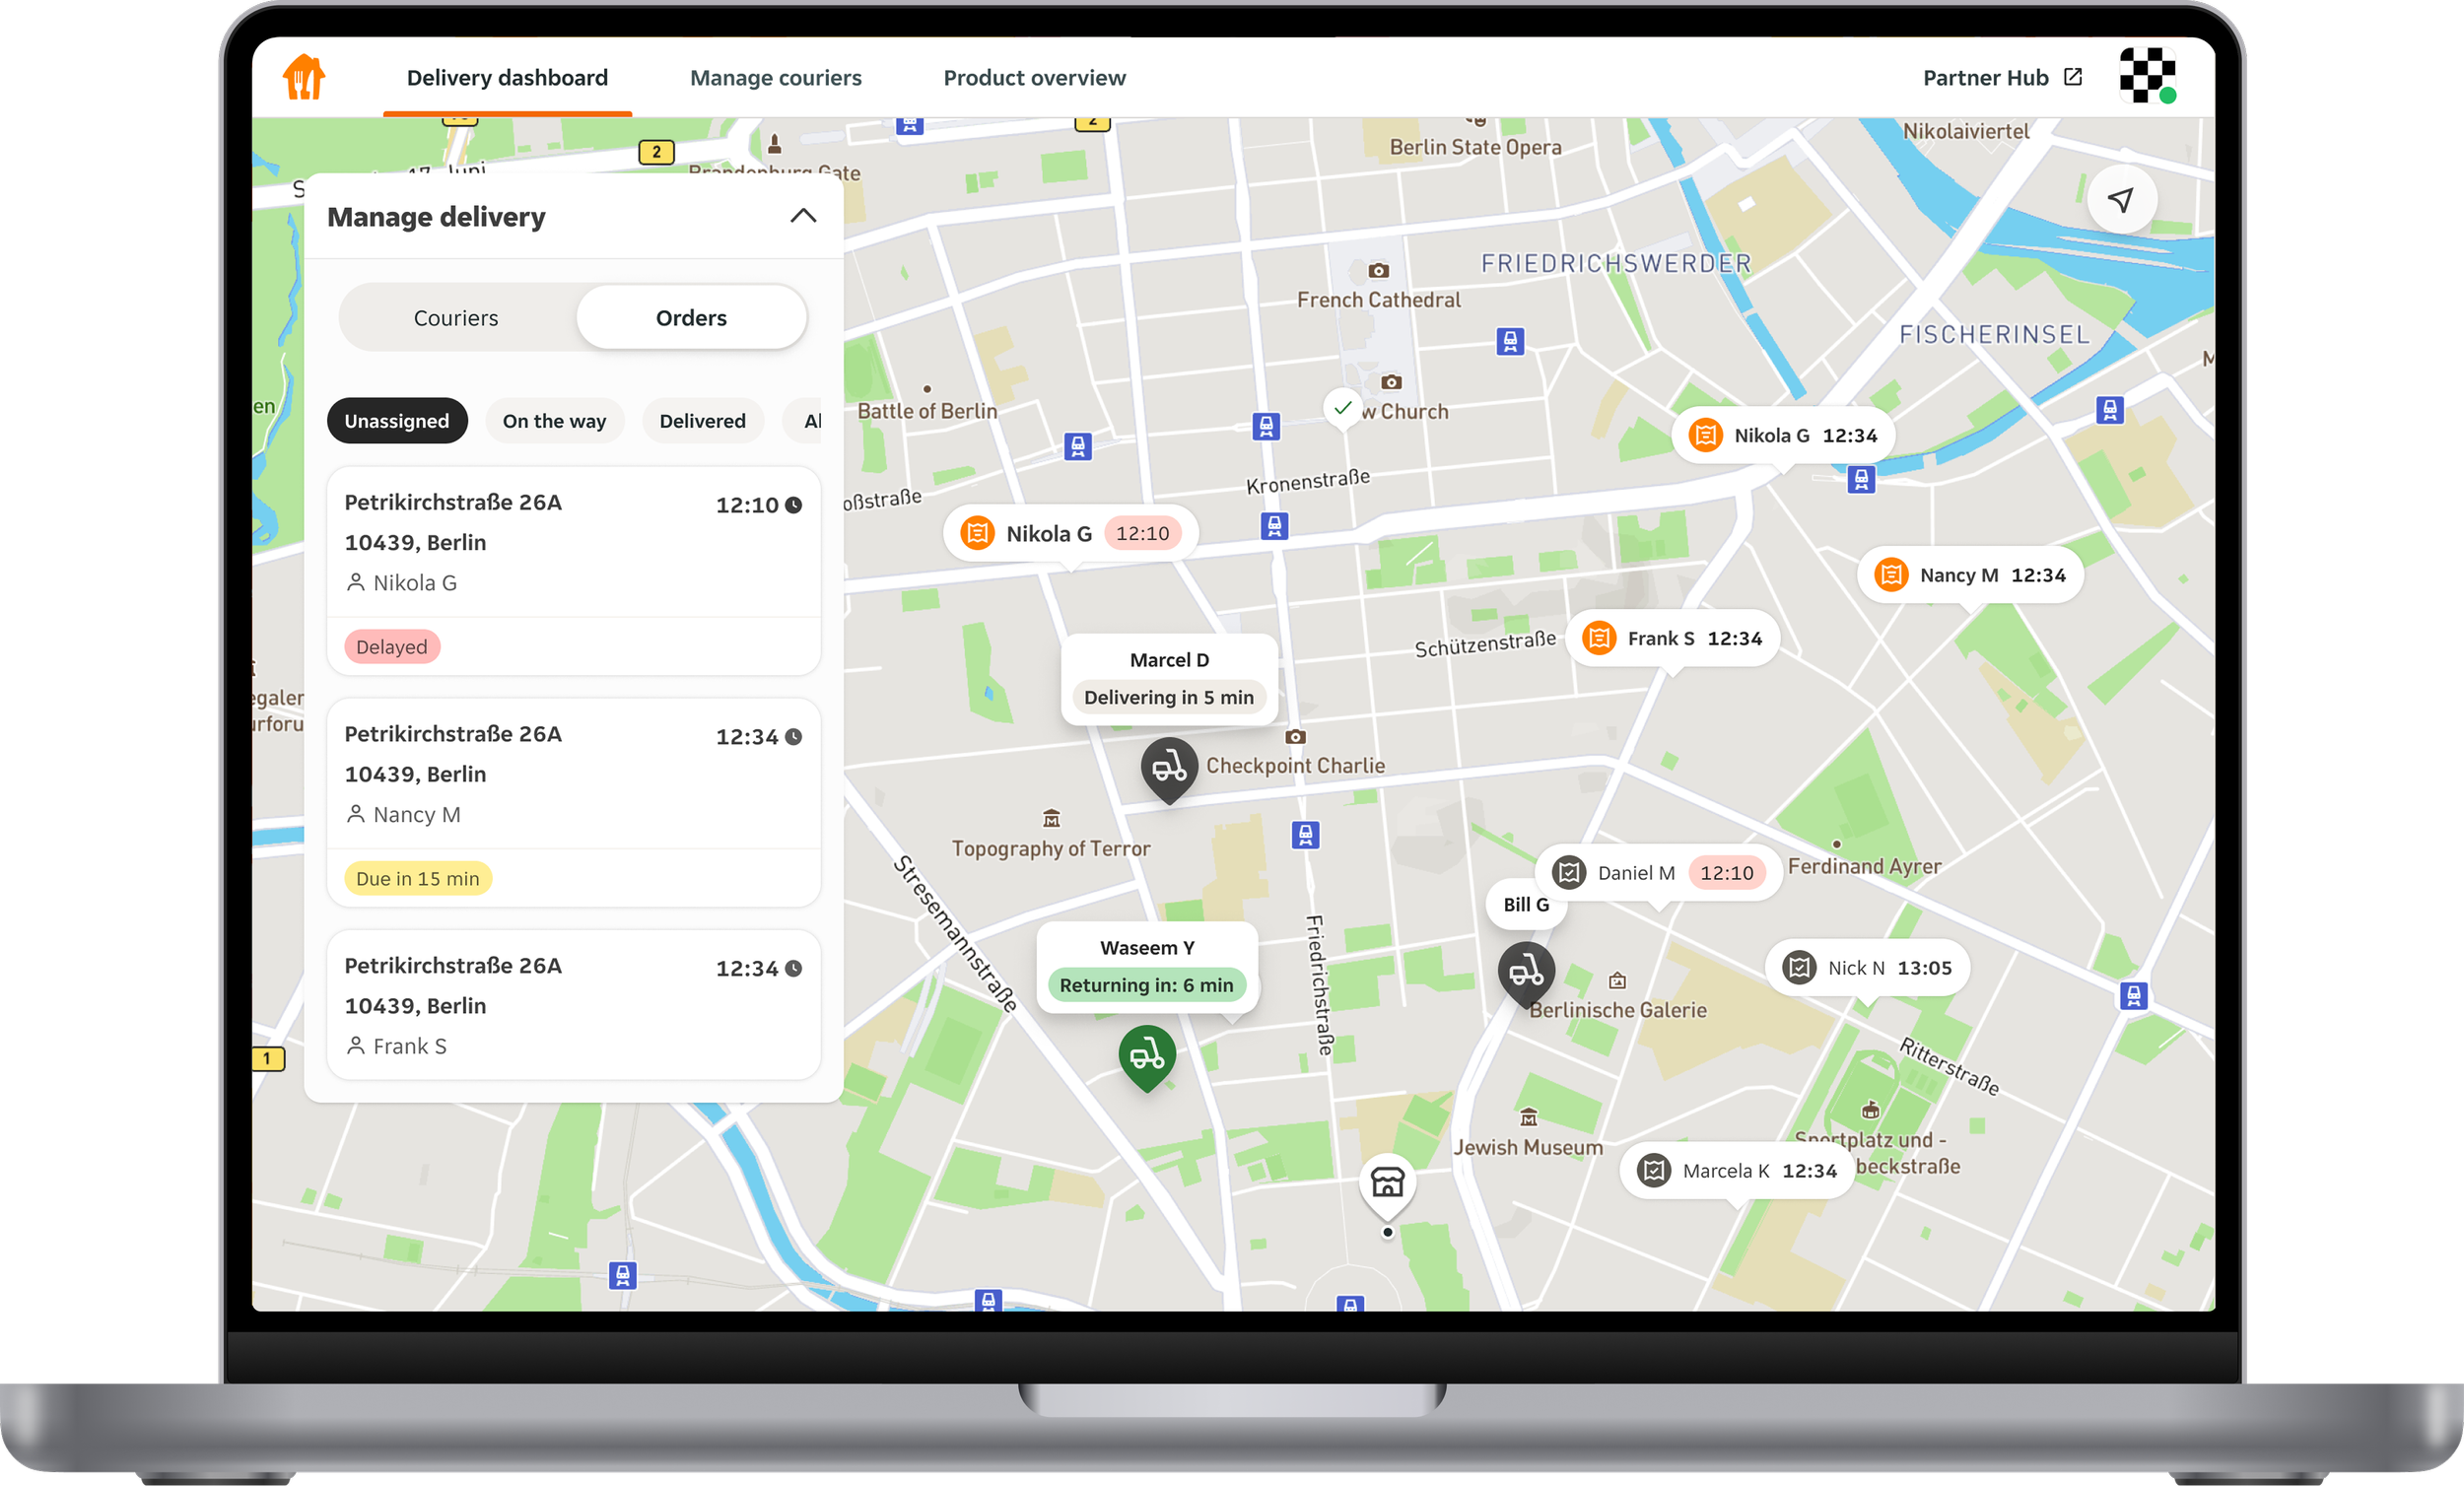
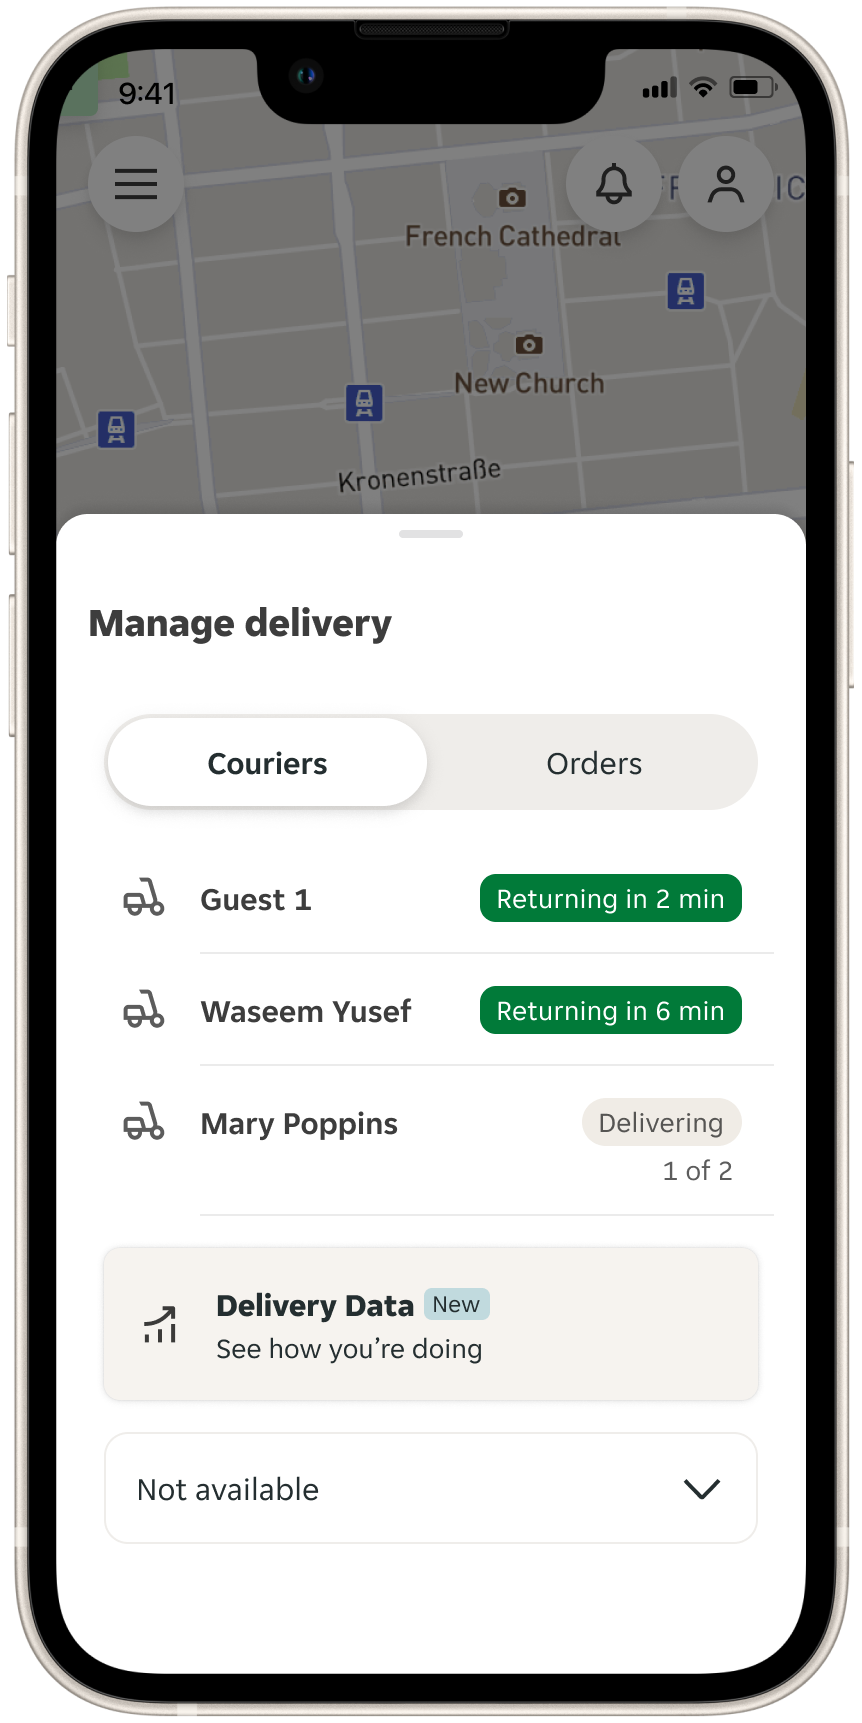
After extensive iteration and testing, we landed on a solution that met our goals for clarity, simplicity, and mobile usability. The new design is mobile-first, with the control panel adapting seamlessly from a bottom sheet on mobile to a card on desktop.
A simplified UI, refined colour palette, and clearer interaction patterns make the experience far less cognitively demanding. We used hierarchy and colour intentionally to surface the most important information for partners, and ensured pooled orders were easy to understand at a glance.
The final round of user research before shipping was overwhelmingly positive.
“99% of it is extremely user friendly and straightforward. Not overbearing at all. Seems so straight forward and really user friendly. Like a more in depth version of when you order a package from Amazon.”
“Super smooth, one of the best prototypes i’ve seen recently. It's very very well done.”
“It’s sleek and easy to follow. Reminds me of Google Maps and Apple Maps.”
The value proposition
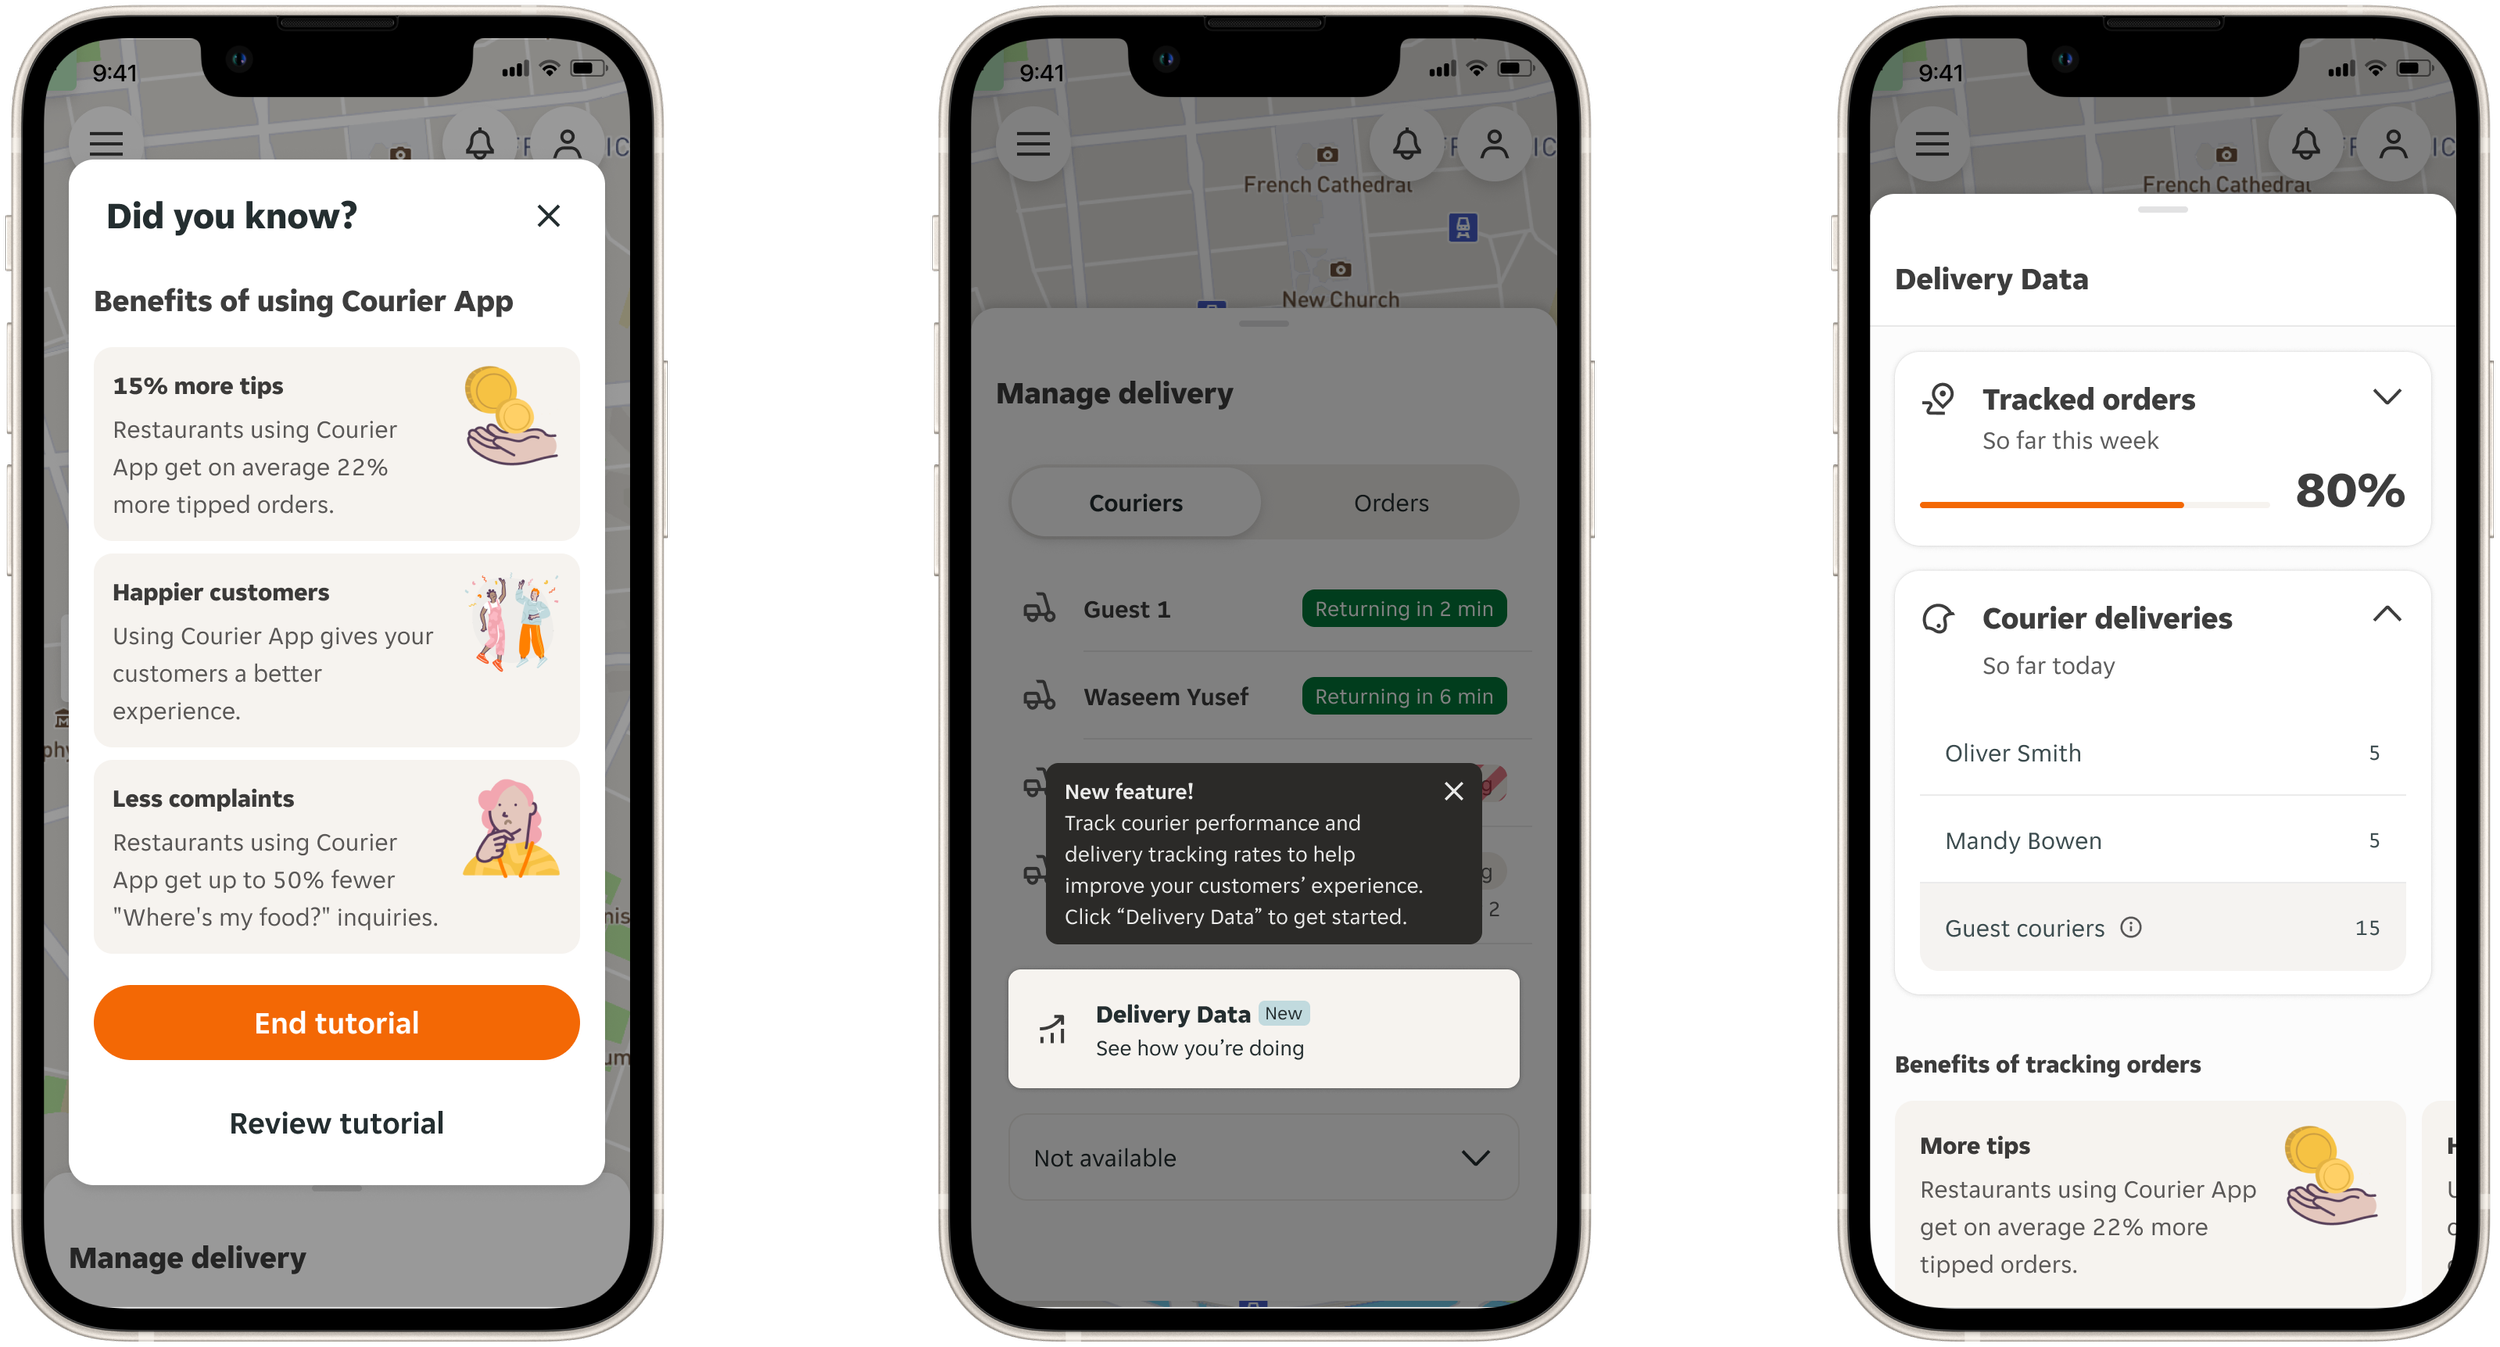
A key insight that we addressed in the first workshop was that many partners didn’t fully understand the value of using the tool. They often didn’t realise that better tracking leads to happier customers, more tips, and fewer “Where’s my order?” inquiries.
To address this, we introduced new experiences to highlight the value proposition and help partners see the direct impact of courier behaviour on customer outcomes.
We approached this in two key ways:
Key benefits
We worked with Data to define the measurable benefits of using the Courier App - including more tips, fewer customer complaints, and better overall delivery experiences. We surfaced these throughout the product, starting with the onboarding flow.Delivery Data feature
A new dedicated view gives partners clear metrics, such as their weekly tracked-order rate and courier-level delivery performance. This feature helps reinforce the connection between consistent tracking and better customer outcomes.
What’s next?
Since launching the new Delivery Dashboard and Delivery Data features, we’ve already seen tangible improvements:
21% increase in regular users of Delivery Dashboard
5% increase in total tracked orders
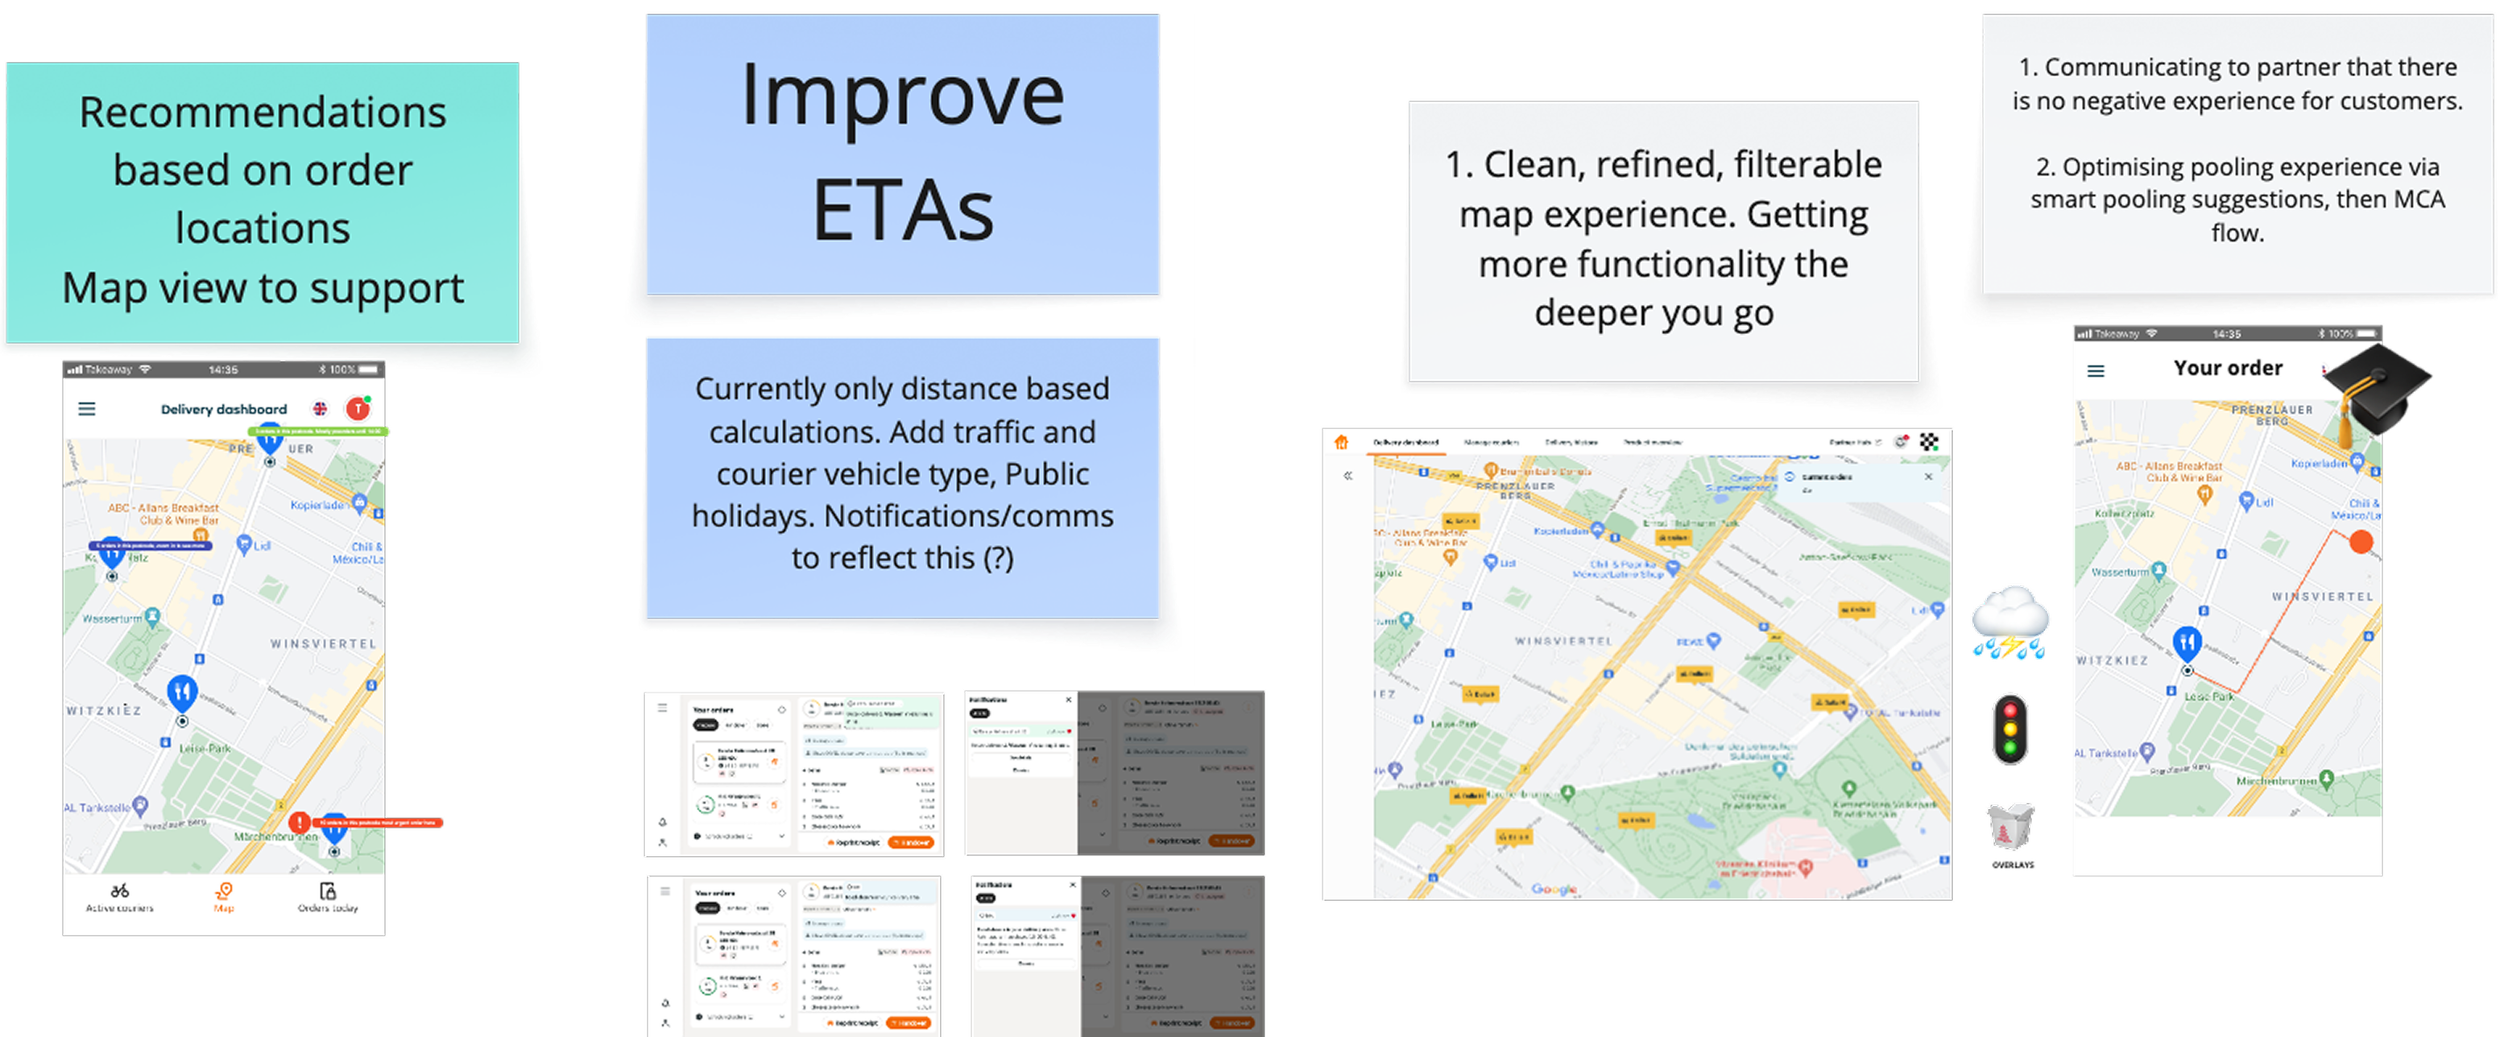
Next, we’re exploring new features to further support planning, communication, and issue resolution, including:
Live alerts for weather, traffic, and other real-time disruptions
A communication channel between restaurants and couriers
A lightweight gamification mechanic in Delivery Data, where restaurants that track 80 percent or more of their weekly orders can earn promotion on the customer app.
Overall, we feel really proud of this project. We turned a tired, unclear tool into a focused, mobile-first product with a strong value proposition - one that actively drives better customer experiences!